Showing posts with label NAHB. Show all posts

Sunday, July 30, 2023

June 2023 Sees a Positive Move When It Comes to Builder Confidence

 For the first time in the past year or so, builder confidence has moved into the positive range. The confidence booster is due to the heavy buyer demand, low home inventory and the increase in productivity in the supply chain. The National Association of Home Builders had a lot of great data to share about the housing market.
As of June 2023, builders’ confidence in newly-built single-family homes rose to fifty-five points. According to the National Association of Home Builders (NAHB)/Wells Fargo Housing Market Index (HMI) this is the sixth straight month that there has been an increase in builder confidence.

“Builders are feeling cautiously optimistic about market conditions given low levels of existing home inventory and ongoing gradual improvements for supply chains,” said NAHB Chairman Alicia Huey, a custom home builder and developer from Birmingham, Ala. “However, access for builder and developer loans has become more difficult to obtain over the last year, which will ultimately result in lower lot supplies as the industry tries to expand off cycle lows.”

“A bottom is forming for single-family home building as builder sentiment continues to gradually rise from the beginning of the year,” said NAHB Chief Economist Robert Dietz. “This month marks the first time in a year that both the current and future sales components of the HMI have exceeded 60, as some buyers adjust to a new normal in terms of interest rates. The Federal Reserve nearing the end of its tightening cycle is also good news for future market conditions in terms of mortgage rates and the cost of financing for builder and developer loans.”
Click Here For the Source of the Information.

Saturday, February 25, 2023

The Housing Market Today

 At the end of 2022, the housing market was still weakening due to buyers not being able to afford home prices due to the spike in home prices coupled with the rising mortgage interest rates. NAHB Chief Economist Robert Dietz reported that at the beginning of 2023, the 30-year fixed mortgage rate was down from November 2022 to 6.5% from 7.1%.

NAHB believes that around 18 million households have been priced out of the current market. The decline in affordability is clearly reflected in current housing sales statistics: The volume of existing home sales in November 2022 was 35% lower than in November 2021. The Census data shows that new home sales were down 15% on a year-to-date basis.

Along with the pricing and interest rate comes low inventory. More construction is needed over a long-term period. According to the National Association of Home Builders, their new study reports that the current housing market is underbuilt by 1.5 million homes. Single-family builder sentiment, which is measured by the NAHB/Wells Fargo Housing Market Index (HMI), has been falling every month since December 2021. Unfortunately, this has been the lowest reading they have seen since 2012 and close to 62% of builders are offering some form of sales incentives to entice home buyers.

Click Here For the Source of the Information.

Monday, October 24, 2022

SINGLE-NEW FAMILY HOMES ARE BUILDING IN THE SMALLER MARKETS

 According to the National Association of Home Builders (NAHB) Home Building Geography Index (HBGI) we are seeing a change in the locations of single-family home builds. The building activity in the last 30 months shows a decrease in building in metro areas, largely due to COVID, housing affordability and highly regulated markets.

“The geography of home building has shifted over the last two and a half years, with more single-family and multifamily construction occurring in lower-density markets.  This shift was first caused by the initial impact of COVID shift continued in recent months due to housing affordability conditions that are causing both prospective renters and buyers to expand their geographic search for housing, aided by hybrid work patterns that allow for a combination of remote office work,” said NAHB Chief Economist Robert Dietz.

Another wrench in the system is the problem with getting building materials, construction labor shortages and and the Federal Reserve’s stingent monetary policy.  “Looking at the last 12 months, single-family production has slowed in all regional submarkets, both large and small, due to ongoing building material production bottlenecks, construction labor shortages, and the Federal Reserve’s tigtening monetary policy,” said NAHB Chairman Jerry Konter, a home builder and developer from Savannah, Georgia.

The National Association of Home Builders Home Buidling Geography Index (HGBI)  is a quartley measurement of building conditions across the country and uses county-level information about single-and-multifamily permits to gauge housing construction growth in various urban and rural geographies.  The National Association of Home Builders tracks single-family and multifamily grow rates and market shares in all seven regions of the U.S. The HGBI takes the place of the of the Leading Market Index (LMI).  The LMI would base their findings off single-family housing permits, employment, and home prices.

Currently it is report that the market share for single-family home builiding in large metro core and inner suburbs too a dive from 44.5% to 41.6% from the fourth quarter of 2019 to the second quarter of 2022.  This shows the precovid vs postcovid figures, accounting for the results due to COVID. In the outer suburbs of large and medium metro areas has jumped up from 17.4% to 19% during the same time period as the decrease in the larger areas. The share also increased from 28.8% to 29% in the small metro core counties and in rural areas it rose from 9.4% to 10.4% This is mainly due to homebuyers wanting to move away from the dense areas during COVID.

Click Here For the Source of the Information.

Tuesday, September 27, 2022

The Competive Buyer’s Market Is Slowing Down

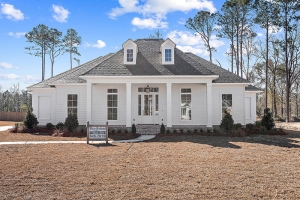
This custom built home is close to New Orleans in Covington.

In the second quarter of 2022 there was a increase to 49% in the share of prospective home buyers who are actively seeking a home to purchase. This comes after a decline for three straight quarters in a row. Rising interest rates have pushed many prospective home buyers righ tout of the market.

According to the NAHB's Housing Trends Report each region saw a different share of prospective home buyers who are actively searching for a home to purchase. The South was the only region that did not see a rise. As for the remaining three, the Northeast went from 50% in the first quarter to 54% in the second quarter, the Midwest went from 40% in the first quarter to 51% in the second quarter and the West saw an increase of 57% in the second quarter from the 46% that was reported in Quarter one.

The housing market has also seen a rise in availability expextations. We have seen a fall for the last five consecutive quarters so this is good news as it grew from 17% to 22% between the first and second quarter of this year. Along with availability expectations affordability expectations also increased. This has been the first increase since 2020 going from 19% to 23% from the first quarter to the second quarter.

Click Here For the Source of the Information.

Thursday, September 1, 2022

2021 Saw A Huge Increase in Single-Family Starts


According to the NAHB's Eye on Housing New single-family starts grew exponentially in 2021. In fact this is the fist time since 2013 there has been such a fast pace in single-family new home starts. NAHB's Survey of Construction (SOC) reported 1,133,145 new single-family were started in 2021. This is 14% higher than reported in 2020.

The South Atlantic, West South Centeral and Mountain Divisions saw the most new single-family units starts which represented 20 states plus Washington DC. This accounted for 41% of the country and over two-thirds of the total new single-family housing starts in 2021. The Pacific Division increased to 106,240 accounting for 9% and the East North Central Division went to 93,693 accounting for 8%.

The other divisions including East South Central, West North Central, Middle Atlantic and New England made up the remaining 16%. Four of the division grew faster than the national level which were the Middle Atlantic with a 26% increase, the East South Central Division with a 23% increas ehte West South Central Division with a 19% increase.

Click Here For the Source of the Information.


Wednesday, July 13, 2022

Rising Home Purchases Means Bigger Spending on Remodeling, Appliances and Furnishings

 According to the data found in the Consumer Expenditure Survey (CES) data from the Bureau of Labor Statistics (BLS), the National Association of Home Builders says that new home buyers and existing home buyers spend thousands of dollars or more on in the first year of owning a home on appliances, furnishings and remodeling. This estimate is derived from the pre-pandemic (2017 - 2019) data collected.


NAHB's report found that during the first year after the purchase of a new construction home, a homeowner will spend on average over $9,250 on their home over a non-moving home owner, and those that purchased an existing home spent around $5,240 over non-moving homeowners. This shows that a home purchase causes an increase in spending. These expenditures are mostly on things like appliances, furnishings, and remodeling.

New home buyers also spend a lot more on property alterations and repairs.  A typical new home buyer is estimated to spend almost twice as much on these projects ($9,288) compared to a similar household that stays put in a house they already own. When looking closer, the study showed that these expenses were from building outdoor features such as a pool, patio, fences, and landscaping.

When someone moves into a new home, they also want to have some new furnishings. This also triggers bigger spending. It is estimated that a new home buyer spends around $3,000 or more on furnishings during the first year of owning a home and $1,870 on appliances.

If a new home buyer purchases an older home, this price can go up even more. It is estimated that they tend to spend around $5,238 more on remodeling, furnishings and appliances. The majority of the spending is on property repairs, alterations and remodeling projects. Homeowners that do not move will spend around $4,282 in a year on home projects while those that buy existing homes will spend around $7,400 during the first year after closing. The data shows that home buying does spark additional spending.

Click Here For the Source of the Information.

Monday, May 16, 2022

March Sees a Rise in Private Residential Construction Spending

 According to the National Association of Home Builders (NAHB) there was a 1% rise in private residential construction spending from February's 0.7%. Total private residential construction spending was 18.4% higher than it was a year ago and spending was at a seasonally adjusted annual rate of $882 billion.


The rise is the result of the strong growth of spending on improvements and single-family. Single-family construction spending was up 1.3% over February estimates with an increase to $472.6 billion. This is great news since the home building industry is still facing supply chain issues and labor shortages.

There was a decrease however in the private nonresidential construction spending to a seasonally annual rate of $497.6 billion which was down 1.2% from February estimates. This still is not bad since it is 8.5% higher than a year ago. The highest increase in this category was in manufacturing at $22.7 billion.

The National Association of Home Builder's construction spending index shows a great rebound back to pre-COVID-19 numbers. The NAHB construction spending index illustrates the solid growth in single-family construction and home improvement from the second half of 2019 to February 2020.

Click Here For the Source of the Information.

Thursday, January 13, 2022

Home Builder Confidence Builds Stronger For Fourth Consecutive Month


Homebuilder sentiment was strong at the end of 2021 according to the NAHB/Wells Fargo Housing Market Index (HMI). This is good news for the home building market despite the inflation scares and material shortages. The NAHB/Wells Fargo Housing Market Index (HMI) reported the builder sentiment in the market for newly-built single-family homes moved one point higher to 84 in December.

As for the regions, the three-month moving averages for regional HMI scores rose in all of the four regions. Both the West and South saw an increase to 87, and the Northeast and Midwest both were are 74. The seasonally adjusted rates for the four regions were the highest in the South at 89, in the West 87, in the Northeast 79, and in the Midwest at 74.

“While demand remains strong, finding workers, predicting pricing and dealing with material delays remains a challenge,” said NAHB Chairman Chuck Fowke. “Policymakers need to work on supply chain improvements and controlling costly inflation. Addressing lumber tariffs would be a good place to start.”

“The most pressing issue for the housing sector remains lack of inventory,” said NAHB Chief Economist Robert Dietz. “Building has increased but the industry faces constraints, namely cost/availability of materials, labor and lots. And while 2021 single-family starts are expected to end the year 24% higher than the pre-Covid 2019 level, we expect higher interest rates in 2022 will put a damper on housing affordability.”

Click Here For the Source for the Information.

Tuesday, January 11, 2022

Single-Family Homes Are Increasing in Size


Recent housing data shows that single-family new construction homes are increasing in size. COVID-19 has changed the way homeowners view their home and its square footage. Stay at home orders made homeowners live, work, school and play in their homes 24/7 during the height of the pandemic.

The Census Quarterly Starts and Completions by Purpose and Design and NAHB analysis revealed in the third quarter 2021 report that the square footage went from 2,337 square feet to 2,541 square feet for a median single-family home.

The NAHB Eye on Housing reveals that median home size has is 9.3% higher since the Great Recession lows. The average size for a single-family home is now 6.2% higher on a one-year moving average basis since the recession.

If you are in the market for a new home contact your local Realtor. A local sales professional can help you with your new home.

Click Here For the Source of the Information.

Sunday, November 21, 2021

Housing Market Demands Still Building Up Builder Confidence Even With Supply Chain Disruptions


The National Association of Home Builders/Wells Fargo Housing Market Index (HMI) released this October shows strong builder confidence. The main reason for this push in builder confidence is the strong consumer demand. According to the report builder's opinion of the market for newly-built single-family homes rose 4 points to 80 this October. This is incredible news since there are still hurdles for builders when it comes to rising material prices and material shortages.

“Although demand and home sales remain strong, builders continue to grapple with ongoing supply chain disruptions and labor shortages that are delaying completion times and putting upward pressure on building material and home prices,” said NAHB Chairman Chuck Fowke.

“Builders are getting increasingly concerned about affordability hurdles ahead for most buyers,” said NAHB Chief Economist Robert Dietz. “Building material price increases and bottlenecks persist and interest rates are expected to rise in coming months as the Fed begins to taper its purchase of U.S. Treasuries and mortgage-backed debt. Policymakers must focus on fixing the broken supply chain. This will spur more construction and help ease upward pressure on home prices.”

The three major HMI categories all saw gains in October. Current sales conditions rose five points to 87, sales expectations in the next six months saw a three-point gain to 87, and traffic of prospective buyers rose a big four points to 65. The Midwest rose to 69, Northeast stayed at 72, the South stayed at 80 and the West unchanged at 83.

The NAHB/Wells Fargo HMI is a monthly survey that measures builders' opinions of the current single-family home sales and expectations for the next six months. A scale is used to rate their opinions as good, fair or poor. Along with this measurement, participating builders are also asked to rate the traffic of prospective buyers. This is scored as high to very high, average and low to very low.

Forecast shows that the end of 2021 will still have a strong housing market with strong buyer demand. If you are in the market to purchase or sell a home now is the time to contact a local sales professional.

Click Here For the Source of the Information.

Wednesday, November 3, 2021

Several Questions To Ponder Before Buying a Home

Purchasing a home is one of life's biggest and most stressful events. With that said, it is also one of the most exciting events. When it comes to advise, everyone has it and while friends and family have your best interest in mind, to make the best decision, you need to ask yourself these three questions.

1. What's Going on with Home Prices?

Home prices are a big part of the housing market. Home prices directly affect how much it will cost you to buy a home and how much you stand to gain as a homeowner when prices appreciate. Waiting might not be in the best interest of the buyer.

The current market is seeing big home price surges and looks like they will continue. Keeping Current Matters reveals Home Price Forecasts for 2021. This is a good tool to use to predict just what it will cost you to buy a home. Today the average of all forecasts is 12.46%. This means a median-priced home that cost $350,000 in January of 2021 will cost an additional $43,610 by the end of the year. So in a nutshell the longer you wait to purchase a home the more it will cost you.

2. Are Today's Low Mortgage Rates Going To Last?

Due to record-low mortgage rates, today's market is booming. Interest rates also put a big dent in the market. The lower the rate the better the market, the higher the rate the slower the market. Just a slight increase can make a big impact on the overall cost of a home.

3. Why Is Homeownership Important to You?

The answer to this question is not the same for everyone. This is a personal decision and can only be answered by you. Financial benefits are important but emotional benefits are also. According to the 2021 National Homeownership Market Survey, there are nine reasons homeowners value homeownership.

These nine reasons directly affect how you feel about your home. Six of the nine reasons include stability, safety, a sense of accomplishment, a life milestone, a stake in the community, and personal pride. The National Housing & Financial Capability Survey from NeighborWorks America reports that Americans believe owning a home provides a sense of safety and security and an increase in financial stability.

Remember owning a home is a life-changing event and will have a big impact. This is a big decision and all options should be well thought out. Using a trusted Realtor can help you with the decision.

Click Here For the Information.

Monday, September 20, 2021

Housing's Growth According to NAHB's Eye on the Economy


June 2020 saw a small decline in single-family new home sales to around 6.6% according to the National Association of Home Builders Eye on the Economy. The annualized rate fell to 676,000. Although the past several months have seen a small monthly decline, the new home sale is still 13.5% higher on a year-to-year basis from 2020.

The small decline according to some industry professionals is from the lack of inventory and the higher construction costs while other industry leaders believe it is caused due to the higher new home prices. New home prices have risen 10% since January 2020.

The new home inventory is down by 44% which is a little over 34,000 homes over the last year. Supply factors including the material, labor and lots are holding builders back. The survey also indicated that today's buyers are not happy with housing affordability. In fact, the share of buyers who can afford less than half the homes available for sale worsened from 63% at the end of 2020 to 71% by midyear.

Although the market is still going strong, those who did not purchase during the second quarter of 2021 was due to pricing. The higher construction cost and development costs have hindered housing prices. The GDP growth for the second quarter was at a low of 6.5%. The good news is that NAHB is predicting an overall growth rate of just under 7% for the whole year. This will be the best rate seen since 1984.

This is still a good time to buy as mortgage rates are still reasonable. If you are in the market for a home, contact your local Realtor.

Click Here For the Source of the Information.

Monday, November 2, 2020

Two Important Building Trends For Today’s Buyer

 The COVID pandemic is still causing uncertainty in the world today. A person’s home has become their essential safe haven. The NAHB has learned from a two-part presentation lead by the Leading Suppliers Council (LSC) there are two building trends that have become essential to buyers in the housing market. Buyers are more concerned about purchasing a smart home and a healthy home.

Homeowners are spending more time than ever at home during the pandemic. People are living,


working and playing all at home. Utility costs are on the rise. Potential homebuyers are interested in smart technologies that can make their home more convenient, secure and energy-efficient. Smart devices are becoming the norm in newly built and renovated homes.

Two-thirds of consumers say they want a connected home. According to Stephen Embry, a partner with the law firm of Frost Brown Todd, in approximately 3 years around 43% of homeowners will have some sort of connected devices in their homes. She says that a home that does not have technology will not be worth as much as a home with technology.

Builders have also seen a trend in homeowners stressing the importance of a healthy home. What does this mean? Consumers want a home with good indoor air quality, plenty of sunlight and the use of non-toxic building materials.

Eco Pulse reports that 66% of Millennials are concerned about indoor air quality. According to the report, in one year six rooms can collect around 40 pounds of dust. There is a possibility that the dust collected could have close to 45 toxic chemicals in it. This is in the air homeowners breathe in their homes on a daily basis.

When building or remodeling a home to improve the home’s health there are many things to consider. Always use clean, renewable energy to help reduce greenhouse gas emissions. Use paints that do not contain VOC that will emit harmful chemicals into the home. Use sound insulation and lighting that adapt to circadian rhythms in the bedroom for improving sleep. Install sensors that monitor air quality. Use double-glazed windows to reduce noise and create better insulation, also make sure your windows provide maximum views to allow natural light in. Most importantly use energy-efficient systems that are easy to control and monitor.

Today more than ever, homeowners want to be able to depend on their homes for their safe place away from the stresses of the pandemic. These two trends are a great way to create a better, healthier environment for families to live, work and play in.

Click Here For the Source of the Information.

Monday, July 6, 2020

Home Purchases Are Still On the Rise

Even though we saw a slight decrease in April, home purchases are still going strong. The Mortgage Bankers Association’s (MBA) Weekly Application Survey shows that purchase activity rose 5.3% with an even higher year-over-year the week of May 29.

The ongoing economic and virus challenges didn’t stop housing demand which boasted a rise in home-buying activity compared to last year. A big part of the increase is the record low in mortgage rates. The Primary Mortgage Market Survey’s 30-year fixed-rate mortgage shows a decrease by 5 basis points which keeps the ongoing record low.

The survey shows that home purchase applications have been increasing for five consecutive weeks. In fact, the National Home Builders Association (NAHB) predicts that the housing industry will be a leading sector when it comes to the country’s economic recovery. Fannie Mae reports, “the refinance volume of applications is poised to reach a 17-year high as it forecasts mortgage rates to tumble further.”

The HMI, which indicates builders’ confidence, showed a sturdy gain in May. According to the current National Association of Home Builders/Wells Fargo Housing Market Index (HMI) when it comes to newly-built single-family homes builder confidence rose seven points to 37 last month. The HMI index also showed an increase in sales conditions to 42, a 46 for the component measuring sales expectations in the next six months and 21 for the measure charting traffic of prospective buyers.

Across the regions the HMI scores’ monthly average increased 7 points in the Midwest to 32, in the South, it rose eight points to 42 and in the West a 12 point increase to 44. The only region which saw a decrease was the Northeast which fell 2 points to 17.


Click Here For the Source of the Information.

Wednesday, June 24, 2020

A Rise In Home Building In Rural Markets

The National Home Builders Association (NAHB) has seen a new housing trend with the COVID-19 pandemic. The latest quarterly NAHB Home Building Geography Index (HBGI) found that residential construction is growing faster in lower density markets.

“We expect the virus could affect future housing preferences for those currently living in the hardest-hit, high-density environments like central cities and that housing demand will continue to increase in medium- and low-density communities,” said NAHB Chairman Dean Mon.

“The first quarter HBGI data reveals that construction growth expanded over the last year more quickly in low population density areas than high-density regions,” said NAHB Chief Economist
Robert Dietz. “This trend will continue as households seek out single-family homes further from urban cores, particularly as telecommuting continues in greater numbers.”

The report reveals that proximity and affordability were two of the biggest catalyst in the shift. People are now second-guessing living in metropolitan areas after the public health crisis hit. During the COVID-19 pandemic, metro residents were more vulnerable because of the crowded living conditions, mass transit, insufficient health and public sector infrastructure. Builders are starting to look outside of metropolitan areas where the land is cheaper and there are more building opportunities.

“The HBGI data is consistent with the fact that housing costs are increasing fastest in large metro suburban counties and smaller metro areas with populations under 1 million where demand for housing is high but supply constraints are tight,” said NAHB Chief Economist Robert Dietz.

“Supply-side issues that are hurting affordability and raising costs for builders include excessive regulations, labor shortages, rising material costs and a dearth of buildable lots in mid- to high population centers.”

All national economic geographies in the country showed a 9.1% growth increase in the suburbs over a one-year moving average. In the education and health services sector (EHS), 4% made up the total single construction and made up close to twice the growth rate in the multifamily construction over the past year. The HBGI also found that the education and health services sector was the top quartile of counties and totaled 25.7% above the total employment sectors.

Click Here For the Source of the Information.

Tuesday, June 2, 2020

The Demand For A Home Office Is On the Rise

The shelter-in-place orders have most Americans working from home. This huge shift in where we spend our time has changed the way certain specialty rooms are viewed. The National Association of Home Builders (NAHB) data that was just collected shows that specialty rooms such as home offices and exercise rooms are on the must list for current home buyers.

The certain preference study data comes from the NAHB’s What Home Buyers Really Want. The survey asks recent and current home buyers what features they want in a home and a community. The
most recent study was conducted in 2018 but the NAHB believes this trend will only grow with the COVID-19 pandemic.

Houzz.com recently conducted a survey that concluded that 55% of homeowners and practitioners have a home office, 25% work from their kitchen or dining room table, and 11% work from their sofa. The study also looked at the challenges the country is currently facing working from home. Thirty-percent find it hard to find a quiet location away from high-traffic living areas while 25% have trouble with getting a strong Wi-Fi connection as well as creating a comfortable workspace.

Working from home has become the norm and here are a few quick tips to enhance the space from NAR’s Realtor Magazine. Pick the right location such as a spare bedroom, dining room, den, or any quieter space you can find. Always make sure your lighting is perfect in the space to avoid eye strain. Last, make it ergonomic by arranging your chair, desk, computer, keyboard, mouse, and phone in a safe and efficient way. Make sure you are comfortable, this will allow for a more productive work from home day.

Click Here For the Source of the Information.

Monday, March 30, 2020

Fed Supports A Smooth Market

The Federal Reserve will address the strains in the market for Treasury securities and agency mortgage-backed securities. The Fed wants to ensure a positive flow of credit to residents and businesses throughout the country.

During their announcement, they revealed they would “purchase at least $500 billion of Treasury securities and at least $200 billion of mortgage-backed securities.” The Feds also proposed an
establishment of a Main Street Business Lending Program that will support lending to qualifying small and medium-sized businesses.

“The Fed’s action represents an open-ended and unlimited expansion of quantitative easing to control interest rates,” said NAHB Chief Economist Robert Dietz. “The central bank’s role of lender of last resort has been expanded to be buyer of last resort in order to support liquidity and the operation of financial markets. The Fed clearly intends to use its full powers to support the economy during an extremely disruptive phase.”

During this time, the central bank will take many steps to see this plan to fruition. They will establish new programs that will support the flow of credit to consumers, employers and businesses in the US. They will provide $300 billion in new financing and the Department of the Treasury will use the Exchange Stabilization Fund (ESF) to provide $30 billion.

There will be three facilities in total. They will create the Primary Market Corporate Credit Facility (PMCCF) which will support new bond and loan issuance. The Secondary Market Corporate Credit Facility (SMCCF) will supply liquidity for outstanding corporate bonds. The third will be called the Term Asset-Backed Securities Loan Facility (TALF) which will support the flow of credit to consumers and businesses. This third facility will issue ABS (asset-backed securities) that are supported by student loans, auto loans, credit card loans, SBA (Small Business Administration and other established assets.

“The Federal Reserve is committed to use its full range of tools to support the U.S. economy in this challenging time and thereby promote its maximum employment and price stability goals,” as stated in a press statement on the Federal Reserve website.

Click Here For the Source of the Information.

Wednesday, February 26, 2020

NAHB’s Analysis Shows Gain in Custom Home Building for 2019

Low Mortgage interest rates have supported a surge in custom home building in the fourth quarter of 2019. The NAHB’s analysis of Census Data from the Quarterly Starts and Completions by Purpose and Design survey revealed that custom home building increased at the end of 2019.

The US Census Bureau’s Survey of Construction (SOC) is a survey conducted by the US Census Bureau and partially funded by HUD (Department of Housing and Urban Development). The SOC reports up to date national and regional data on housing starts, completions and characteristics of all residential housing. The data which is collected includes the start date, completion date, sales date, sales price (single-family houses only), and physical characteristics of each housing unit, such as
square footage and number of bedrooms. The Quarterly Starts and Completions by Purpose and Design is based on the Building Permits Survey and from the Survey of Construction (SOC).

The National Association of Home Builder’s analysis shows 44,000 total custom building starts during the fourth quarter of 2019. This is a 16% gain over the same quarter in 2018 which totaled to 38,000 total custom building starts. Data shows a solid gain occurred during the last four quarters with custom housing starts totaling to 177,000.

The custom home building market will continue to expand with demand from both owner and contractor built homes. The low mortgage interest rates will protect the custom home building market thus maintaining the positive custom home building outlook.

Click Here For the Source of the Information.

Tuesday, October 29, 2019

September was a Positive Month For New Home Sales

This September was reported to be 15.5% higher year-over-year due to the lower mortgage rates. The National Association of Home Builders’ data shows that sales were 7.2% higher in the first nine months of 2019 than those reported in the first nine months of 2018. This first nine months this year
brought in 527,000 sales beating the 491,000 sales reported for the same time frame in 2018.

Signs show sales volume increasing with the more new homes that are reported being built. New home sales for the first nine months of 2019 were up 12.8% in the South, and 7.3% in the West compared to the first nine months of last year.

This fall is a great time to purchase a new home with the median new home sales price at $299,400. Right now, nearly 15% of newly built homes are priced under $200,000! This buyers' market will not last, so if you are in the market to purchase a home, buy your new home before the new year.

Click Here For the Source of the Information.

Wednesday, November 21, 2018

New Homes Are On The Rise

The housing market is booming and new home construction is benefiting.  NAHB reports that private residential construction spending has increased.  This increase is across the board from single family
to multi-family homes.

Mulit-family accounts for $64.2 billion which attributes to the majority of the increase. Single family was shown to also hold a steady growth with a 0.9 percent increase in the third quarter of 2018.

The Census Construction Spending data details this strong growth which is from 2010 to April 2017. The rise in construction spending comes from the high spending on multi-family. The annual nonresidential spending increase  was based on class of power which totaled $8 billion, office comes next at $7.6 billion and last is lodging totaling $4.2 billion.


Click here and Click here for sources of the information.